У самому розпалі Чемпіонат Європи з футболу – справжнє cвято для фанів. Щойно закінчився груповий етап Чемпіонату і, на жаль, збірна України припинила боротьбу за головний футбольний трофей Європи. Але шоу триває! Киплять емоції, радість перемоги і смуток поразок, і ллється пиво.
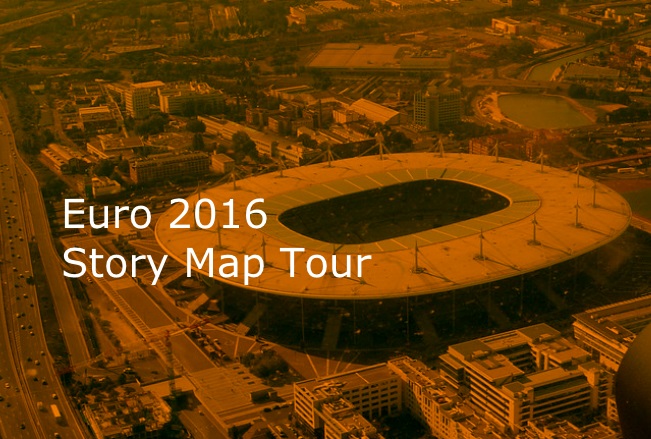
Цього року чемпіонат приймає Франція, яка виборола право на проведення європейської футбольної першості серед інших претендентів. Тож футбольне свято прийшло до міст Франції. Але до яких? Запрошуємо до Map Tour по містах Франції, які приймають національні команди та їхніх вболівальників на своїх стадіонах.
Рис. 1. Story Map Tour «Міста і стадіони ЄВРО 2016 у Франції» (клікніть на зображення, щоб подивитись тур)
Як зробити Story Map Tour?
Вибір інструментарію
Для створення додатку використано платформу ArcGIS Online, а саме інтерактивний конструктор побудови карт-історій (Map Story). Конструктор працює в браузері (рекомендується Chrome) і не потребує написання коду. Тим не менш, є можливість скачати вихідний код додатку на Github і допрацювати його під власні потреби і побажання.
Користувач має можливість розповісти свою історію, що складається із веб-карт і мультимедійного контенту, використовуючи різні шаблони. Для представлення стадіонів у містах Франції я обрав шаблон «Тур по карті-історії» – «Story Map Tour». Цей картографічний додаток найкраще підходить для послідовного представлення окремих локацій, що супроводжується фото або відео, підписами місць і коротким пояснювальним текстом. Фотографії або відео виконують роль певних орієнтирів, які допомагають користувачеві у виборі місця на карті і візуально доповнюють характеристику такого місця.
Вихідні дані і їхня підготовка
Створити «Story Map Tour» можна або безпосередньо запустивши інтерактивний конструктор, або опублікувавши карту із ArcGIS Online як веб-додаток, або створивши додаток з меню «Мої ресурси». Всі варіанти доступні з персональним безкоштовним аккаунтом (тепер для входу в ArcGIS Online можна використовувати обліковий запис Facebook і Google) і передплаченим обліковим записом організації; різниця – у наборі опцій. Наприклад, із обліковим записом організації доступна опція завантаження медіа безпосередньо на «свою» хмару в ArcGIS Online у вигляді окремого шару.
У будь-якому випадку не обійтись без підготовчих робіт із збору та організації даних. Отже, вихідні дані такі:
- Перелік міст і стадіонів, на яких відбуваються матчі національних збірних – дані взяті із офіційного сайту організатора чемпіонату – UEFA.
- Для детальнішого опису додано інформацію про те, для якого футбольного клубу арена є домашньою; скільки глядачів можуть бути присутніми на матчах, які проводяться під егідою УЕФА; рік відкриття стадіону. Також додано перелік матчів, які проводяться на стадіоні.
- Фотографії стадіонів – використані зображення із відкритих джерел.
Створення картографічного веб-додатку
Тепер потрібно додати всі ці дані до Story Map Tour і поєднати їх між собою. Основна задача – прив’язати медіа. У нашому випадку зображення – до місць розташування стадіонів. Для налаштування Story Map Tour існує декілька способів. Зокрема, є можливість завантажити CSV-файл із прописаними налаштуваннями: координатами локацій, URL-посиланнями на медіа, підписами і поясненнями. Саме так я і зробив у такій послідовності (figure 2):

Рисунок 2. Старт створення Story Map Tour
в ArcMap було створено точковий шейп-файл із місцеположенням стадіонів у містах Франції, для точного визначення яких використано OpenStreetMap – одну з базових карт ESRI.
Потім таблиця атрибутів цього шейпу із заповненими полями координат (формат координат – «десяткові градуси») конвертована в Excel-файл. До цього файлу додані поля, які описують параметри вхідних даних:
name (назва локації);
description (опис, додаткова інформація);
long (довгота);
lat (широта);
pic_url (посилання на зображення іконки);
thumb_url (посилання на слайд).
Зображення перед цим були завантажені на Picasa, їхні URL-адреси прописані у відповідних полях pic_url і thumb_url.
Відредагований CSV-файл був імпортований до інтерактивного конструктору, після чого Story Map Tour був доопрацьований і налаштований. Зокрема, змінена кольорова гама оформлення додатку, базова карта, налаштований початковий екстент.
Декілька зауважень:
1) Після імпорту CSV-файлу кириличний текст (поля “name” і “description”) не прочитався. Тому всі необхідні тексти додані окремо.
2) Текст може містити теги HTML, що дозволяє форматувати підписи і описи на власний розсуд. Наприклад, напівжирним виділено назву стадіону, кольором в розкладі матчів «Україна», додано переноси рядків:
(фрагмент тексту із тегами HTML
<b>Матчі групового етапу</b><br>Німеччина –
<b><font color=”#dc143c “>Україна </font></b> (Група С) – 12.06.2016<br>).
3) Можна вказати лінк на два окремих медіа-файли: окремо для іконки і для слайду.
4) Зображення для кращого візуального сприйняття краще звести до одного формату. Рекомендоване співвідношення сторін складає 4:3.
__________________
Джерело заголовного знімку.


