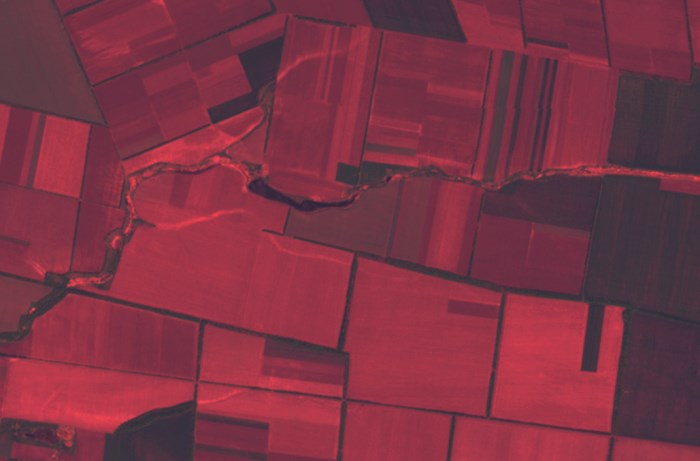
It seems that our previous posts have shown all the complicity and importance of soil map creation process. Remote sensing (RS) is a powerful and promising tool for improving this process. This term can be interpreted very freely, it covers various means of obtaining information, depending on the electromagnetic wave range used, equipment applied and the platforms the equipment is mounted on.
In this post, we will talk about soil monitoring and soil mapping using satellite imagery. We have already mentioned using different methods in remote research in our previous post.
Why satellite data?
This choice is not random. In soil mapping, satellite images still are leading among other methods of RS in terms of price and quality. Satellite data comparing to aerial photography is much cheaper and their detail, even for ten meter spatial resolution, is sufficient for most needs of large-scale mapping. Satellite imagery becomes even more attractive to soil scientists due to increasing number of free satellite imagery data. A good alternative for satellite imagery are images acquired by UAVs. Their main advantage is high mobility and selectivity, but the “the price issue” is still relatively high.
Concerning spectral range
The visible range is the most used for soil studies. This was in part due to traditional orientation to visual perception of information. “Remote sensing of soil” started in 1930s from aerial photography and attempts to decrypt soils in the images, additionally, natural color of the soil, that is perceived in the visible range, is an indispensable and extremely important characteristic for the soil diagnostic.
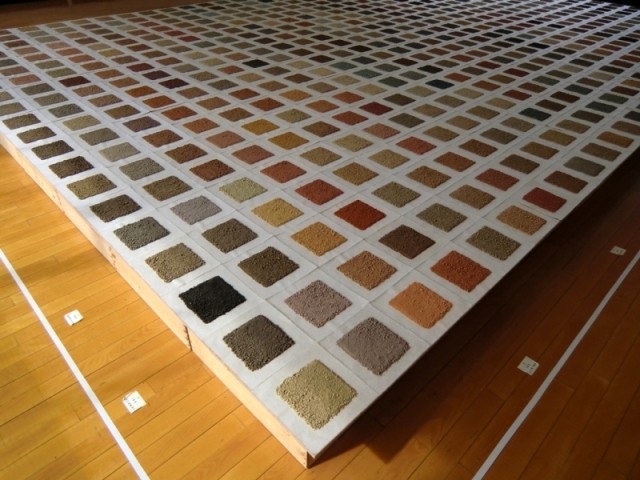
The color of natural soil has so many shades, that inspires artists to create impressive colorful panes.
Source: Soil library Japan
Source
Japanese artist Koichi Kurita, who admires color properties of soil, creates real pieces of art from soils samples that he collects daily since 1990. The photos show a palette of natural colors of soil, presented in Koichi Kurita’s “Soil Library”
Specific soil colors are caused by a combination of different organic and mineral compounds. Mixtures in different proportions and interaction of separate colored materials create individual coloration of the soil at each point.
Classic “Zakharov triangle” illustrates the dependence of the most common type of soil colors on the content of suitable pigments. This triangle is ever present in soil textbooks for almost a century. It lacks blue-green shades, that are characteristic for soils with reduced iron, the amount of “colorants” in soils is significantly greater than pictured, and humus compounds have more shades than only the black. But to understand the formation of the soils, this is quite a sensible scheme.
“Zakharov triangle” (1927). Shows that integral color formation of soil is resulted by mixing black of organic matter, red (iron oxides) and white (carbonates, silica oxide, ammonium) colors.
Besides that, soil density and dispersion of soil particles, soil aggregate structure (the size and ratio of the soil aggregates of different sizes) affect the formation of the reflected signal in the visible range. That is why field roads on arable lands look like light strips, although, by all chemical compounds, soil of a road and a field are identical.

(c) Digital globe
An example of the influence of soil density and surface roughness (caused by different soil cultivation) on soil color in the visible range)
Soil moisture is also very important. Moisture is a factor that has a big influence on soil reflectance. It is mandatory for soil remote evaluation to select images where the soil surface is in the air-dry state.
More details about soil color, determining it and its diagnostic role you can find in a great article by Dmitriy Orlov. For twenty years, that have passed since the time it was written, soil scientists’ knowledge about the theory of soil reflectance in visible range has remained nearly on the same, unfortunately insufficient, level. Therefore, aerial photography soil data in the visible range currently allow estimating a very limited set of soil properties.
Infrared range (IR). This term covers a wide strip of the electromagnetic spectrum from the near infrared and far infrared to thermal radiation. Accordingly, the soil will look differently in different areas of the infrared range. This is due to a variety of reasons – from the molecular structure of organic matter and vibrations of molecules in films of tightly connected water to a temperature of the soil. Near infrared range, which is sensitive to the humus content in the soil, the content of iron compounds and humidity, is often used in soil monitoring and mapping.
Hyperspectral scanning
Hyperspectral scanning uses a large number of narrow spectral bands. In Ukraine, the first research on the use of hyperspectral scanning for soil monitoring was conducted in the early nineties at the Institute of Soil Science and Agrochemistry named after O.N. Sokolovsky. A group of scientists led by A.V. Shatohin conducted research of soil profiles using a stationary Polas-Ocean spectrophotometer, with wave range from 425 to 795 nm, 512 spectral bands with an interval in 0,1 nm and a laboratory IR spectrophotometer PSCO/ISI IBM 4250 with wave range from 1620 to 2320 nm, 375 spectral bands.
The research took place in a laboratory. Soil samples were taken from for the entire depth of soil profiles 10 cm apart, were dried and adjusted to a homogeneous condition by crushing soil aggregates and sieved through a sieve with an aperture of 1 mm. That was done for minimizing an impact of humidity and roughness on the formation of the reflected signal.
Unfortunately, researchers had only obtained preliminary results. Later these works were stopped and have not been developed due to an absence of funds. So today Ukrainian soil science has nothing to be proud of in this area.
Meanwhile, hyperspectral scanning, which allows obtaining the spectral signature of soil, depending on the content, the number and parity of separate minerals and of simple chemical compounds is potentially very promising for soil studies (5).
To conclude talking about electromagnetic ranges we should recall that the penetration depth of electromagnetic waves in the soil depends on the wavelength. That is why optical scale (visible or near IR) allow evaluating properties only the surface layer of soil, whereas, for example, radio waves give an opportunity to “penetrate” into deeper layers and to assess, for example, depth of rocks under the soil or depth of groundwater.
What can satellite images tell about soils?
Before we start, we should clarify: “Tell whom, and for what?”
From the practical point of soil use, the most important aspect is the fertility level. If the soil is suitable for crop cultivation and if specific measures to improve productivity are needed.
Using to satellite imagery, can we determine the nutrient content in the soil and identify areas of insufficient nutrition for plants? And the answer will be “No.” And also – “Yes.”
“No.” It is impossible to determine the content of nutrients and trace elements in the soil by its spectral brightness, because they are contained in the soil in such condition and quantities, which can not significantly affect the color of the soil.
“Yes.” We can conclude about the spatial heterogeneity of the nutrient content in the soil based on the indirect relationship between a sufficient number of nutrients in the soil and the content of chlorophyll in the plants (primarily used for assessing nitrogen) or between the level of humus in the soil and its fertility.
Since ancient times it is known that the darker the soil, the better and more fertile it is. In most cases, the dark color is caused by humus content in the soil. It is a specific organic matter that forms in soils and without which the soil will not exist. Scientists say: “Humus is a soil invariant.” Simply saying, humus is the king of soil and if it were a person it would say: “I am soil!”
Soil fertility is characterized by humus content because this content causes it directly or indirectly. The availability of soil nutrients and physical parameters of topsoil create comfortable conditions for plant life. Humus quantity depends on air and water permeability of the soil, their ability to retain moisture and provide optimal conditions for plant growth and development. As a biologically active substance, humus provides the functionality of soil microbiota and as a sorbent – soil resistance to chemical contamination.
Accordingly, quantitative assessment of humus content in the soil, or, in other words, the amount of humus, is one of the most important criteria in soil mapping, when assessing the quality and monitoring of soil degradation. Traditional field methods of examination require large amounts of manual labour of removing, preparing and analyzing soil samples. Besides, maps of humus content based on discrete data of point observations always have a large error of interpolation.
The use of remote sensing data provides an opportunity to get information about humus content in the topsoil for large areas faster and more correctly. This reduces the complexity and the cost of the work.
The general rule for remote monitoring of humus content using data in visible range says “The lighter the soil, the less humus it has.”
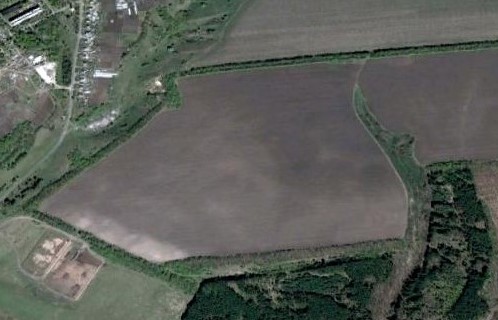
(c) Digital globe
An image of the field with soils damaged by water erosion. Light area – eroded soil, where topsoil humus level is washed away with water, only layers with low humus content are visible.
Of course due to satellite images it is possible to identify not only the humus content, but also, for example, granulometric composition, spreading of salt licks, solodized soil, soil moisture etc. But it is the technology of humus content detection (or organic carbon, which is almost the same) that is the most well-researched and repeatedly tested; the reliability of its results is proven by numerous studies. So we’ll talk about it in detail in the next post.


