As we’ve already discussed in the post on soil maps, today Ukraine has an urgent need in updating them. Soil maps currently in use had become outdated at least 10-15 years ago.
Surveys carried out to map soils are quite labor-intensive as they require a considerable number of soil pits to be laid and sampled.
Methodology for carrying out a classical large-scale soil survey has been formed upon the basis of the rich soil mapping experience of the 20th century. However, the present gives new technical means and requires a new format of the soil mapping results’ presentation.
What does soil mapping consist of?
In short, the main points of soil mapping are:
① identification of soil’s genetic belonging (i.e., soil’s designation taking into account its main properties – origin, humus content, erodibility, hydromorphism, salinization or sodification, texture etc.);
② delineation of the identified soil unit’s spatial distribution and mapping it.
The first task is currently solved in a single possible way. At a key point, typical for a certain location, a soil pit must be dug and analyzed, and a precise soil type uncovered with this pit must be determined with maximum detail.
Almost solely, success both in choosing the most typical location and in the accuracy of the characterizing the soil uncovered with the pit, depends on the soil scientist’s level of proficiency. Nowadays, there are no technical means to automatically identify a soil by its photograph. (But potentially, this may be a perspective way of soil diagnostics’ development.)
To get fuller and more accurate information on soil texture and chemical properties of the soil uncovered by the pit, samples from each of the genetic horizons must be taken and analyzed in a laboratory.
In case historic records of the large-scale soil survey are available for the mapped territory, then a task is substantially facilitated.
Firstly, soil texture, identified 50 years ago generally retains itself to date as it is a conservative characteristic that changes quite slowly.
Secondly, soil’s genetic status could have changed significantly in just a few cases that are familiar to any specialist. That is, Chernozem remains Chernozem, and brown earth remains brown earth.
The most significant changes of the soil cover in the last decades relate to the humus content, salinization, hydromorphism, and – essentially – soil’s erodibility.
And in the latter case, the point is not just in the change of the soil erodibility degree and redistribution of washed off and deposited or deflated soils’ position, but in the quite different understanding of the soil status as well. A quite common drawback of the historic soil maps is incorrect diagnostics of the short-profile slope soils with attributing them as eroded – which was typical for the time of the first soil survey.
So, having a historic soil map, a soil scientist and cartographer can roughly assume what to expect and what to pay special attention to even before the survey starts.
The second task is establishing the outlines and boundaries of soil types.
It is here where modern remote soil investigation methods and geostatistical analysis methods come in handy.
During the 1957-1961 soil survey and subsequent tours of its materials’ corrections, determining the boundaries of the separate soil individuals required laying additional half-pits and ancillary pits. Nevertheless ths process largely relied on expert knowledge, subjective. Besides, a significant amount of soil individuals stayed out of cartographers’ attention as it was almost physically impossible to ‘catch’ them. Even aerial photography didn’t make it much easier.
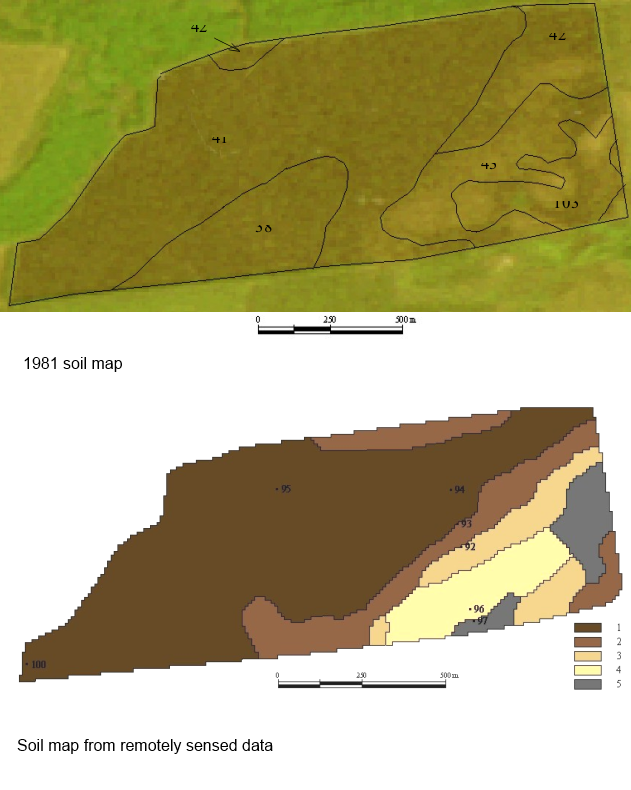
Today, thanks to the capabilities of remote sensing and digital terrain analysis, accuracy and objectiveness of soil individuals’ areas identification have increased to the degree meaning there will be a fundamental difference in the pattern of the soil cover on old and new maps.
Comparison of the historic soil map fragment with a soil map obtained using modern techniques. (Courtesy of A.B. Achasov)
A soil map is built from the integration of body of data on soil properties and their formation conditions within the mapped territory. This data can be obtained both by classic field methods and as a result of the DEM and soil RS data GIS analysis.
Besides, one shouldn’t forget that apart from the soil map itself, maps of individual soil indicators are widely used today. They are especially demanded in the agricultural production where it is necessary to track the current dynamics of the soil parameters change which determine crop yield – content of humus and individual nutrients, soil density and humidity etc. Such maps are composed for individual fields with no reference to the soil genesis and are often based solely on the instrumental data of the arable layer analysis. They can be created in any GIS having a geostatistical analysis block.
Remote sensing survey methods
Let’s discuss in short the remote sensing methods used today to map soils and how exactly they can help us. It should be stressed that different remote sensing methods aren’t equivalent in soil mapping. While the methodology of certain methods usage – like aerial photography or multispectral scanning – is well-proven and there is a wide practical experience of their application for soil mapping, for other methods – like radar, georadar or thermal survey – we can rather speak only of the potential for their usage.
The principal characteristics that mainly determine the spatial inhomogeneity of the soil cover are soil texture and humus (or organic carbon) content. Knowing these two indicators and having terrain and hydrothermal conditions characteristics, an experienced soil scientist can predict soil cover with large reliability when composing forecast soil maps.
Today in Ukraine methods of remote detection of humus content in soils is based on the data of multispectral and photographic survey. It should be noted here that detection is based upon the empirical dependences specific to each soil type, thus it is Ukrainian researchers’ studies what is important in our country.
Soil texture identification is also possible upon this data but only indirectly, through the change in spectral brightness due to the humus content decrease in lighter soils. Soil texture directly impacts the reflection of radio waves so it can be identified by radar survey data.
Generally, photographic survey and multispectral survey have quite a broad use in the soil mapping. From these surveys’ data, soil is identified by both indirect and direct indications. To quantitatively assess certain soil characteristics like humus content or content of individual chemicals, empirical dependences between these parameters and image brightness in certain wave ranges, or values calculated from the brightness indexes, are used.
Image pattern is a very important qualitative component for determining soil boundaries and soil diagnostics as well. Erosive network, waterlogging areas, bedrock exposure, abrupt change in soil parent material, spots of saline soil, areas of sodification,– this list of what you can see with the image pattern is by far not complete.
Radar survey data can be used to assess such soil parameters as humidity, structure density, soil grading, and structural and aggregate composition.
Ground-penetrating radar (GPR) which only comes into usage for soil mapping in Ukraine enables a remote assessment of humus profile depth, presence and depth of the underlying soil parent material, depth of groundwater occurrence, and reportedly – their chemical composition (mineralization). Although, ground-penetrating radar surveys are more effective for specific types of soils than the others, this method is extensively used, for example, in the USA and is considered to be promising for soil science.
And what about GIS?
Unlike its analogue paper predecessors, modern soil map is not just a ‘frozen moment’ in the life of the soil cover, but a dynamic mirror of this life. That is, what we today understand as a ‘correct’ digital soil map is not a scanned paper prototype, but a data base of soil attributes visualized as a soil map. Moreover, it should be a data base that contains detailed quantitative and qualitative information on soil cover that can be displayed in an understandable way for any novice user. Such soil maps can be and must be constantly updated in accordance to the soil data update. So, a modern digital soil map can’t be created and can’t exist otherwise than in the GIS environment.
An example of soil cartography transferring to the modern digital format of data bases are existing soil data bases of Ukraine, Russia and Belarus created upon the base of the available soil data.
Further reading (the following materials have been used when writing this post):
In English:
- Jim Doolittle My Thirty Years with Ground-Penetrating Radar
- Handbook of Agricultural Geophysics – B. Allred, Et Al., (CRC, 2008) BBS
In Ukrainian:
- Великомасштабне картографування ґрунтів за допомогою інтегрального аналізу даних дистанційного зондування й цифрових моделей рельєфу: методичні рекомендації / [А.Б. Ачасов, А.О.Ачасова, С.Ю. Булигін та ін.]. − Харків: вид-во ХНАУ, 2010.
- М. І. Полупан, В. Б. Соловей, В. А. Величко Методологія великомасштабного дослідження ґрунтового покриву та сучасні вимоги до його нормативного забезпечення/
- Гічка Максим Миколайович. Наукове обгрунтування використання методів дистанційного зондування в моніторингу грунтів : дис… канд. с.-г. наук: 06.01.03 / Національний науковий центр “Інститут грунтознавства та агрохімії ім. О.Н.Соколовського”. — Х., 2007.
- Трускавецький С. Р. Методика складання великомасштабних карт ґрунтів України за матеріалами дистанційного зондування / С. Р. Трускавецький, Т. Ю. Биндич, М. М. Гічка, С. В. Калюга // Вісник ХНАУ. – Х., 2008. – № 1.
- С. А. Шоба, И. О. Алябина, А. В. Иванов и др. Особенности построения и использования почвенных баз данных России, Украины и Беларуси


