We are sure that our regular readers won’t be surprised by the abbreviations above. For those who have tuned in recently, we recommend checking out posts about digital elevation models and open GIS, TNTmips in particular.
At some point, MicroImages Company had helped numerous postgraduate students of the 90’s a lot by sending for all comers CDs with the time-unlimited version of the software, then named TNTlite, in that distant non-Internet era.
Back to our subject. To build digital models in TNTmips GIS we can use all the power of the module – or, according to the program’s terminology, the process – of the Surface Modeling. The set of working tools here is really impressive. Surface Fitting, Profiling, Triangulation, and Contouring operations allow working with input data of almost any format and to create various models of terrain representation.
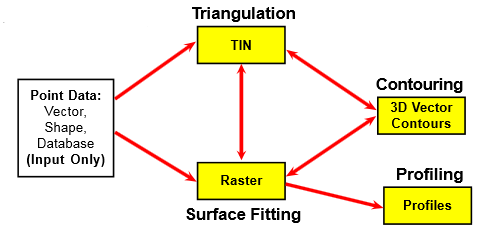
Given the time and the inclination one can hold a full cycle of data transformations, e.g. from the input point data set through the triangulated model and to the raster model, and lastly – build a set of vector terrain contours. The full diagram of possible DEM transformations is shown in fig. 1.
Figure 1. DEM building options, diagram taken from the booklet
If you have a set of data coordinate in three axes – in the simplest case, those are geographical longitude and latitude and absolute height – you can easily start creating your own tridimensional world. For probably the most common Surface Fitting operation there are given eight methods of interpolating input data which can be represented as
a set of points,
contours,
triangulated network
or a set of linear parallel transects.
While the first three methods of the data representation are quite traditional, the last option can be surprising. Indeed, this way of data collection and representation is not typical for terrain, but the results of the aeromagnetic survey, which measures Earth’s magnetic field voltage along the plane flight route, will have this peculiar form. It is clear that the Surface Modeling process can be used to build both real surfaces and quasi-surfaces.
Among the eight interpolation methods there are such popular ones as Kriging, Minimum Curvature, Inverse Distance etc. For students circle, Contours methods will be undoubtedly interesting, as contours are the principal form of terrain representation on topographic maps. A detailed description of every processing method is given in the help booklets set which can be found on the developer’s web site. Regardless of the selected interpolation technique the results of the DEM modeling will have raster format in any case.
To get a TIN-model, a corresponding operation has to be selected. Interestingly, input data can be both vector and raster. The main TIN-building method is, naturally, based upon the Delaunay principle.
Contouring operation suggests resolving an uncommon task of building contours from the raster DEM. In particular, it can be interesting when taking into account the public availability of the global DEMs covering almost all of the Earth’s surface and built upon the results of the optical stereoscopic survey and satellite interferometric radar survey. Despite all the progressiveness of such form of the terrain representation, sometimes one may wish, as they say, something simpler, as our ‘cartographic mentality’ was formed on the basis of conventional maps with a traditional ‘contoured’ model of terrain representation.
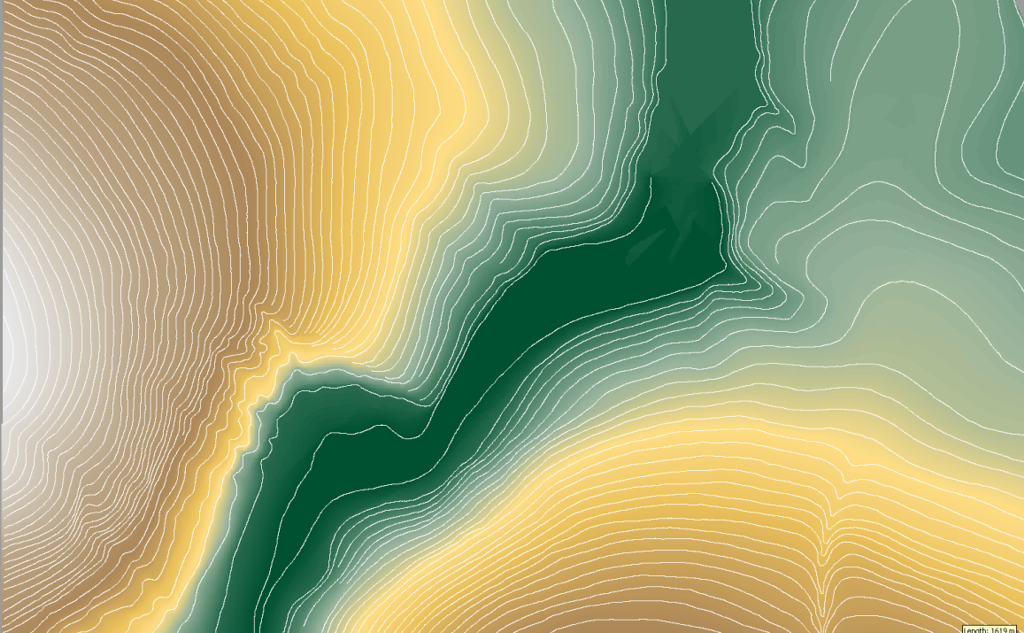
Figure 2. Initial contours, against the raster DEM
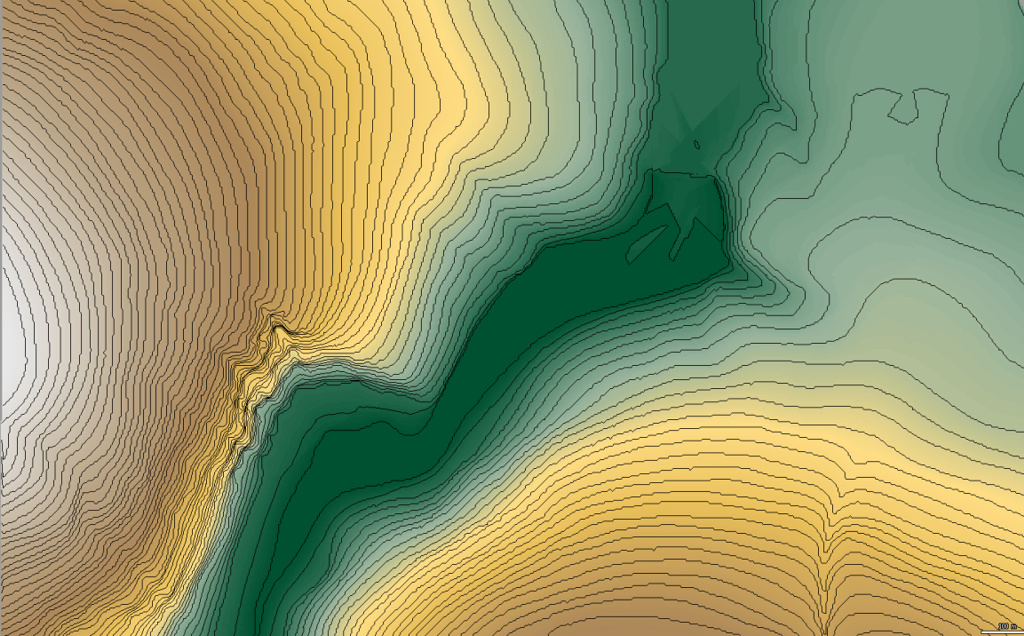
Figure 3. Derived contours, against the raster DEM
Figures 2 and 3 provide a comparison of the results of the raster contouring operation with the initial data taken from the topo map. The workflow used was the simplest possible: 1) vectorize the contours of the topographical map, 2) build a raster DEM upon them, 3) build new contours upon the DEM. As we can wee, despite the overall similarity in the illustrations, there is some loss of information. It is clear that a ‘Chinese whispers’ principle plays a certain part here as we compare the original – isohypses from the maps – with its second derivative – isohypses received after raster processing. And if we mention that these initial contours are themselves a result of interpolation of point elevation values obtained during the geodetic survey, then at all… But we can’t give way to despair. A problem of DEM accuracy is very complex, still it can be solved. We will discuss that separately.
An original option of the terrain representation is the creation of a series of parallel vertical profiles (stacked profiles) with a Profiling operation. Initial data is a raster DEM. After processing we get an alternative method of a tridimensional surface visualization providing a possibility of a view from various viewpoints and with different vertical scale (fig. 4-5).
Figure 4. Digital elevation model
 |
 |
Figure 5. Results of the Profiling performed at angles of 0 degrees (a) and 45 degrees (b)
For each profile a base line is chosen, its elevation is used for deviations calculation, which is correspondingly displayed in the profile. Frankly speaking, this way of visualization doesn’t seem optimal to us, but it is very interesting.
Summing up our brief review of the TNTmips terrain-creating capabilities, we will mention its considerable potential and will announce that this is not the only one positive moment of using the program.
To be continued…
__________________
Grapics by Chris Cole from Noun Project is used in this post

