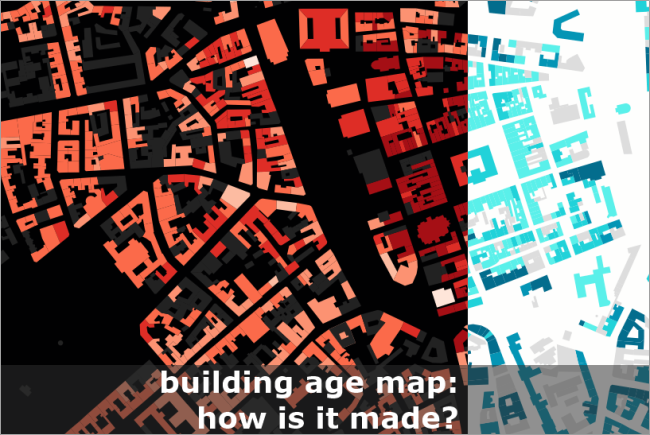
Lately there has been a rise in building age maps. One of the first maps of this kind was made for Portland, followed by other cities. Then the map of Amsterdam turned into a map of the Netherlands, New York /Brooklyn and Vancouver got their own maps as well.
For Europe a map of Barcelona was created, and Moscow (doesn’t work very well though), Reykjavik and Ljubljana.
Moreover, a map of dwelling age was created for the whole of England and Wales. The map shows modal ages for aggregated ares. Interesting patterns can be traced in this geography and time combined in one map.
Every single one of these maps can be very entertaining and take away lots of your time. They have various designs, additional info and features, but at the same time are quite similar.
– And how about Ukraine? – you ask.
– We also have something to show you! – we rely.
The first map of this kind to be made in our country was one for Kyiv. Nothing strange here 
A group of active Kyiv citizens has created this map using the age info they found in real estate ads. That’s why the map is still a bit empty.
Similarly, a building age map was made for Lviv. We will discuss it in more detail.
This particular map visualises the age of Lviv buildings, the data was made available by the city council. The OSM community have added the age data to the map. As of now there are buildings lacking age data, so you can contribute too. Go to OSM editing tools and add the missing info to buildings, that is if you know the info.
How does the map work?
The visualisation was done by Intetics team using Leaflet, an open source JavaScript library for mapping. As a base layer raster tiles were used with OpenStreetMap data. The buildings are displayed based on age classification. When you hover the mouse over a certain polygon, the top panel of the map shows additional data with exact construction year and building address. This kind of mapping requires a number of interactive points of polygons. Displaying these may decrease the computer’s performance, or simple may not work correctly.
In our case the map interaction was implemented by UTFGrid tiles.
What are those?
UTFGrid is a kind of data that represent points and polygons in text format, that’s where the name comes from. It’s a kind of “ASCII Art”.
          !######$$$$%%% %%%% %
          !#######$$$$%%%    %%%
         !!#####   $$$%%%    %%%
         !######  $$$$%%% %% %%%
        !!!####  $$$$$%%%%  %%%%
      ! !###### $$$$$$%%%%%%%%%%
     ! !!#####  $$$$$$$%%%%%%%%%
    !!!!!####   $$$$$$%%%%%%%%%%
    !!!!!####   $$$$$$%%%%%%%%%%
    !!!!!####   $$$$$%%%%%%%%%%%
    !!!!!#####% $$   %%%%%%%%%%%
    !!!!!### #      %%%%%%%%%%%%
    !!! #####   ''''%%%%%%%%%%%%
     !   ###      ('%%%%%%%%%%%%
       ) ### #  ( ((%%%%%%%%%%%%
      ))  ##   (((((%%%%%%%%%%%%
      ))  #    ****(+%%%%%%%%%%%
       )        %**++++%%%%%%%%%
       , , ------*+++++%%%%%%%%%
.     ,,,,,------+++++++%%%%%%%%
..  /,,,,,,------++++++%%%%%%%%%
.  //,,,,,,------000++000%%%%%%%
  211,,,,,33------00000000%%%%%%
 2221,,,,33333---00000000000%%%%
222222,,,,3635550000000000000%%%
222222,,,,6665777008900000000%%%
22222::66666777788889900000 %%%%
22222:;;;;%%=7%8888890  0   %%%%
22222;;;; ==??%%888888  00 %%%%%
222222 ;;  =??%%%8888       %%%%
222     ;;   ?A>>@@@          B%
CCC      ;;   DEE@@@          BB
Each object is represented by its own symbol, that is connected to JSON data by the symbol’s code. So the tiles with these symbols are hidden behind the graphic map representation, i.e. they are not rendered. This allows to quickly match related values without addressing the server.
To better understand the mechanics of the process have a look at this demo.
You can also read a bit more on specifications and work with this format here or here.
If this topic is interesting for you, we can describe it in more detail.
So what do you think about the age maps? What is it you like about them? Why are they created at all?
Tell us in the comments!


А чи був десь детальний опис створення? Як абсолютному профану, цікаво зрозуміти, як це працює
Можливо, ось такий опис підійде:
https://www.wired.com/2013/10/how-to-map-building-ages-in-your-home-town/