How can a DEM be used practically? How to turn DEM into a map of slopes or aspects, and how can these maps be further used – all this is covered in detail in our post.
We have already started talking about terrain. Now let’s talk about more specific things, and particularly – about using DEMs for agrarians – and not just for them.
Let’s get back to the land. It is land that is undoubtedly the pivotal everlasting wealth of our country.
One of the main disasters for the land, or, to be more precise, for soil resources, is water erosion – a true scourge of agriculture.
An easy and effective measure to fight this phenomenon is the proper land management depending on terrain, as the latter is a powerful regulator of water streams that destroy soil cover. Particularly, depending on slope steepness a differentiated placement of crops is recommended. In order to do that, all land is divided into the so-called ecological technological groups (ETG) each one of them having a special usage mode depending on the slope of the land surface. For instance, for territories having slopes steeper than 7 degrees it is best to sow them with perennial grass that securely protects soil from erosion, or to completely take them out of cultivation.
This kind of land group determination is traditionally performed using topographic maps with circular reticulation. We will not describe this methodology with a history longer than 50 years in detail, but it’s worth to mention high complexity and low accuracy of this procedure. Of course, the alternative for the method is the usage of the digital elevation models.
To speed up identification of ecological technological groups we may run a ready-to-use script, or write one by ourselves, in our case it is to select in the resulting cartogram all pixels based on the given interval scale.
Given below is a fragment of script written in SML (Spatial Manipulating Language) which is used in TNTmips GIS software. This script is used to distinguish two zones – with slopes less than 3 degrees and from 3 to 5 degrees:
if (slope<=3)
return (1)
if ((slope<=5) and (slope>3))
return (2)
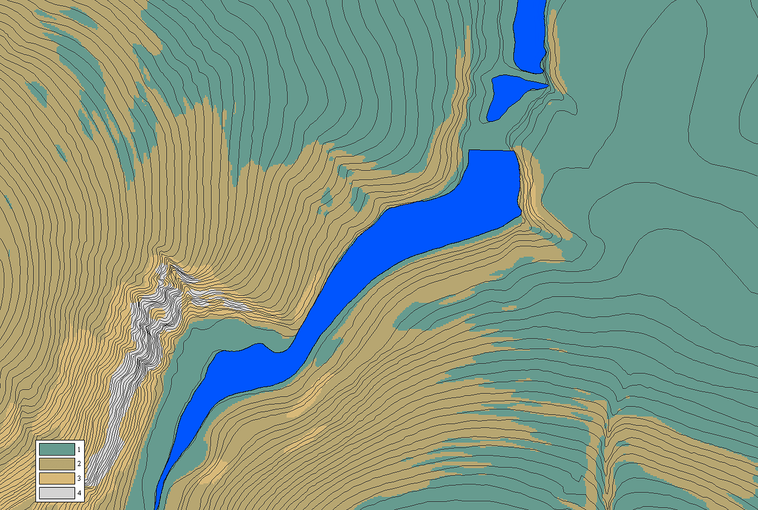
It seems this fragment doesn’t require additional comments, as it can be understood intuitively. Figure 1 shows the results of running this script. Four eco-technological territory groups are yielded based on slopes’ grade measure: 0-3, 3-5, 5-7 and >7 degrees.
Figure 1. Area’s agricultural zoning layout
Selected pixel zones can be automatically converted into vector objects. This will make the further work on the erosion-preventive land-use planning more convenient.
Given certain experience and necessary software, proposed approach is much faster and more accurate than the use of typical cartometric procedures involving paper, or modernly speaking – analogue maps.
Once decided to move from paper to digital form, you solve not just a single mentioned task. DEM will become a reliable spatial matrix for your territory, a basis for its use and development.
Another applied usage of DEM is building of surface aspect maps, i.e. models reflecting slopes’ orientation in the cardinal directions. The principal geographical function of aspect is insolation redistribution in the landscape and, accordingly, influence on the moistening conditions. So, mathematical formalization of slope and aspect parameters will enable the quantitative processing of territory’s hydrothermal conditions, which is very important for many activity fields, and, naturally, for agriculture.
Generally, aspect is measured clockwise from northern direction and calculated according to the general formula:
aspect = arctg (-[dz/dy] /[dz/dx])
Notation is the same as for the slope calculation formula: dz/dy stands for the altitude rate from north to south, dz/dx is for west-east direction.
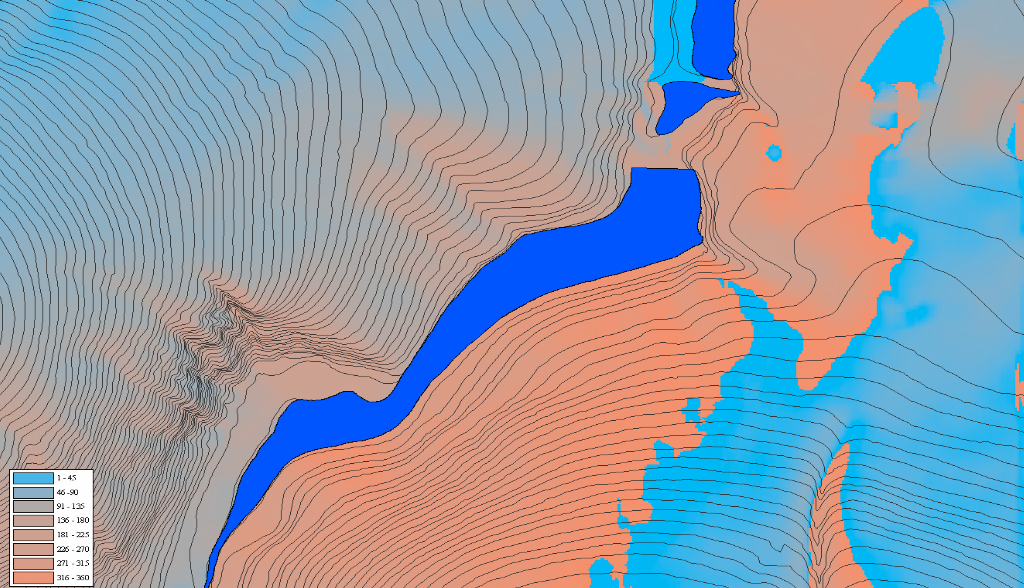
A certain trick should be noted: usually a program will prompt you to calculate pixel values in the azimuthal scale having 360 degrees (fig. 2). It is logical from a surveyor’s point of view, but will be of little use for an agronomist. As ‘cold’ north-oriented slopes can have a quantitative characteristic of both 1 and 359 degrees.
Figure 2. Aspect cartogram
Situation can be improved by re-building the model derived according to the following formula:
DNA = 180о – │180о – A│,
Where DNA is due north aspect in degrees;
A is slope aspect in degrees.
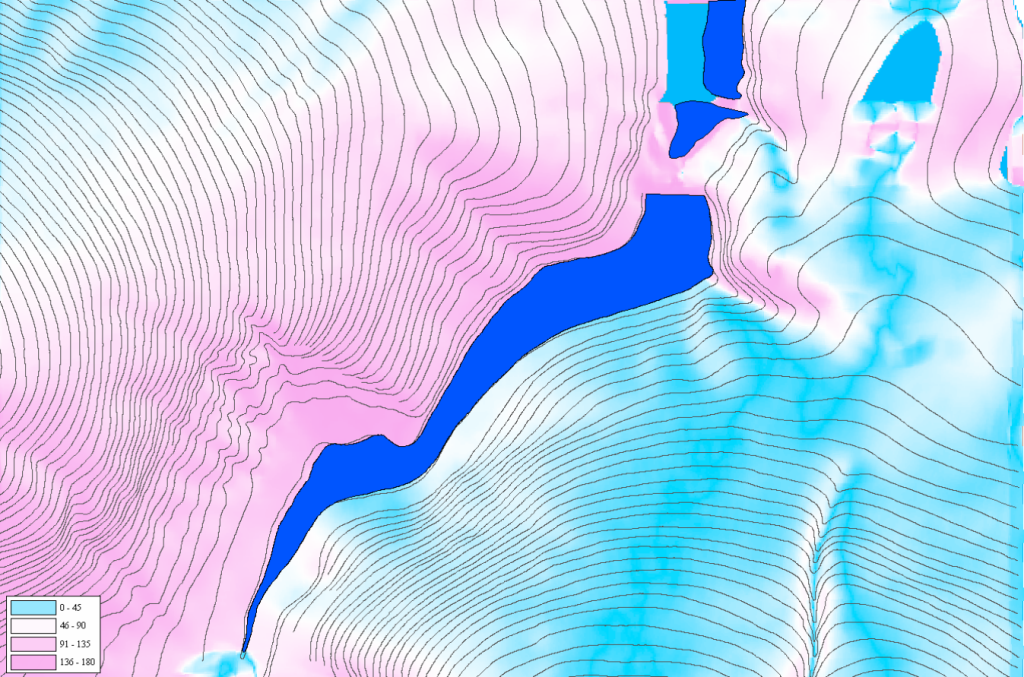
The result will be a cartogram that evaluates the aspect compared to due north orientation and makes it possible to approximately estimate the insolation differences for the given territory (fig. 7). Advantages of this cartogram over the preceding one (built using the absolute aspect values) are well seen in the south east of the given area. Territory which in fig.6 is shown in two parts contrasting by azimuth value has in fact a uniform northerly aspect which is clearly seen in figure 3.
Figure 3. Aspect parameter values cartogram
However, accurate estimations of spatial inhomogeneity of the hydrothermal conditions based on DEM can only be performed using complex physical insolation models. That is models which enable evaluation of territory’s insolation conditions considering both direct and diffuse solar radiation. For instance, in ArcGIS there is a dedicated ‘Solar Radiation’ toolbox [in the Spatial Analyst toolkit] which allows to estimate insolation both for a specific point and for the entire landscape. Among free GIS products such capabilities have SAGA and GRASS.
So we have cleared it up that it is possible to quantitatively evaluate solar energy income to the earth’s surface from terrain. And this gives us a key to both managing hydrothermal conditions and rational use of steep lands. So, maps that are derived allow to calculate potential photosynthetically active radiation (PAR). That is a part of solar energy used by plants for photosynthesis which in turn gives base for crops planning. Taking insolation into account in complex mountainous relief conditions enables optimization of crops placement. Information on territory’s hydrothermal conditions can be used to evaluate land parcel’s agropedological potential and, consequently, influence its monetary value.
And these are far not all practical aspects of DEM usage. To be continued…
__________________
Grapics by Chris Cole from Noun Project is used in this post

