Класифікація — це спосіб дешифрування космічних знімків, тобто розпізнання та виокремлення на космічних знімках будь-яких об’єктів. Класифікація належить до автоматизованих способів дешифрування. У разі їх застосування користувачу не потрібно вручну обводити межі об’єктів, за нього це робить комп’ютерна програма.
За ступенем участі користувача в процесі автоматизованого дешифрування алгоритми класифікації поділяють на дві групи: класифікація без навчання (автономна класифікація, некерована класифікація, кластеризація) та класифікація з навчанням (керована класифікація).
Класифікація з навчанням виконується в декілька етапів:
- визначення кількості класів та їхнього змісту
- створення навчальних вибірок (користувацьких еталонів)
- перевірка якості навчальних вибірок
- вибір алгоритму (способу) класифікації з навчанням
- виконання класифікації
- післякласифікаційна обробка карти класифікації
- оцінка точності результатів класифікації
У цьому пості ми розберемо, як обрати найкращій метод класифікації з навчанням. Сучасне програмне забезпечення для обробки космічних знімків дає багатий вибір алгоритмів (способів) класифікації з навчанням. Тому перед кожним користувачем постає питання — який алгоритм класифікації найкращий? Але однозначної відповіді не існує. Жоден алгоритм не здатен бути ефективним у всіх можливих випадках. Навпаки, для кожного алгоритму є своя сфера застосування. Визначити найкращий алгоритм класифікації можна почерговим перебиранням. Тобто спробувати кожний алгоритм, оцінити точність отриманих результатів, а потім вже визначити той метод, що дає найкращий результат. Але це може бути довгим процесом, особливо якщо ми оброблюємо знімки великого об’єму.
Щоб одразу правильно обрати метод класифікації, треба знати математичні підстави різних алгоритмів. З цього знання виникає розуміння, коли можна використати певний алгоритм, а коли ні. Але не всі користувачі мають добру математичну підготовку. Тому ми зробили схему вибору методу керованої класифікації. На цій схемі показано декілька найбільш поширених способів класифікації з навчанням. А саме (рис. 1):
класифікація паралелепіпеда (parallelepiped classification),
мінімальна відстань (minimum distance classification),
відстань Махалонобіса (Mahalanobis distance classification),
бінарне кодування (binary encoding classification),
найбільша правдоподібність (maximum likelihood classification).
Схема доволі проста. Треба йти згори донизу, від питання до питання, обираючи один із двох варіантів відповіді. Розберемо зміст цієї схеми та проілюструємо його конкретними прикладами вибору алгоритму керованої класифікації.

Рис. 1. Вибір найбільш ефективного алгоритму класифікації
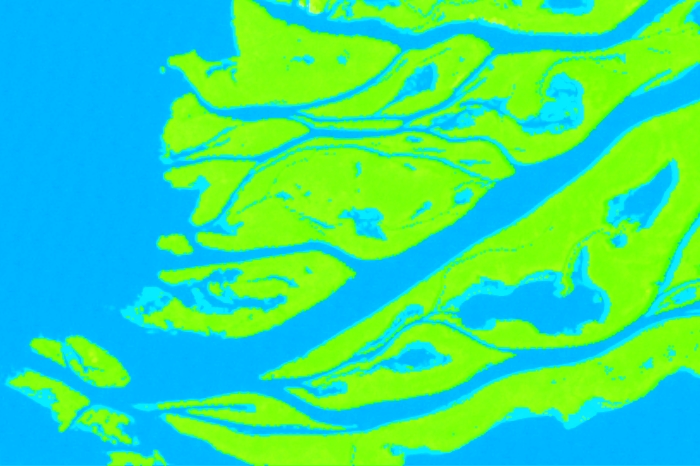
Передусім треба звернути увагу на те, скільки класів ми виділяємо. Якщо треба розділити на знімку лише два класи й обов’язково віднести кожний піксель до одного з двох класів, то найліпше використати бінарне кодування. Типовий приклад такої ситуації наведений на рисунку 2. На ньому ліворуч показаний фрагмент космічного знімку Landsat 5TM за 16 серпня 2010-го року (комбінація каналів 7:5:3). Він охоплює територію плавнів у дельті Дніпра. Тут необхідно дешифрувати класи акваторії та суші. Для цього створені дві навчальні вибірки. На рисунку 2 у центрі вони позначені відповідно блакитним і зеленим кольором.

Рис. 2. Приклад використання бінарної класифікації
Результат бінарної класифікації показаний праворуч на рисунку 2. Тут зверніть увагу на те, що всі пікселі зображення були розподілені між двома класами. Якщо, крім цих класів, були б ще й інші об’єкти, які треба віднести до некласифікованих пікселей, то замість бінарного кодування, необхідно було б класифікувати зображення іншім алгоритмом.
Якщо ми дешифруємо декілька класів, то для обрання способу класифікації треба проаналізувати положення класів у багатоспектральному просторі спектральних ознак. Як це робити, детально описано в попередньому пості про роботу з інструментом n-D Vizualizer у програмі ENVI. Можливі варіанти взаємного розміщення хмар значень різних класів показані на рисунку 3 (на прикладі двомірного простору спектральних ознак). Для кожного з цих варіантів є свій найбільш ефективній спосіб керованої класифікації.

Рисунок 3. Можливі варіанти взаємного розміщення хмар значень різних класів у просторі спектральних ознак
Спочатку треба перевірити, чи є перетинання між хмарами значень класів. Якщо класи в багатовимірному просторі спектральних ознак не перетинаються, то можна використовувати класифікацію паралелепіпеда. Найчастіше так буває, коли ми дешифруємо невелику кількість класів, що належать до принципово різних типів поверхонь. Наприклад, коли ми одночасно дешифруємо водойми, рослинність, ґрунти, поверхні штучних матеріалів, гірські породи. Зазвичай у таких об’єктів сильно відрізняється спектральна відбивна спроможність. Приклад подібної ситуації наведений на рисунку 4.
На рисунку 4 ліворуч ми бачимо фрагмент космічного знімку Landsat 5TM за 26 квітня 1986-го року (комбінація каналів 4:5:3). Він охоплює територію заплави та терас Сіверського Дінця, що простягається нижче міста Чугуїв. Для дешифрування створені навчальні вибірки (рис. 4, праворуч). Вони відповідають хвойним лісам (зелена вибірка), водній поверхні (жовта вибірка), відкритим піскам на терасі (синя вибірка), трав’янистій рослинності на піщаній терасі (червона вибірка) та листяним лісам (блакитна вибірка). На рисунку 4 унизу ми бачимо розташування хмар значень цих вибірок у багатомірному просторі спектральних ознак. Жодна з вибірок не перетинається з будь-якою іншою. Це вказує на те, що найкраще класифікувати зображення за алгоритмом параллелепіпеду.

Рис. 4. Приклад ситуації використання класифікації паралелепіпеда
У випадку, коли хмари значень класів перетинаються, треба проаналізувати їхню форму. Вона може бути проста або складна. Стверджувати, що ми маємо просту форму хмари значень, можна коли вона подібна до кулі або еліпсоїду. А коли вона подібна до чогось на кшталт амеби, то це вже складна форма. Якщо ми маємо складну форму хмар значень, то у такому випадку найбільшу ефективність покаже класифікація за алгоритмом відстані Махалонобіса.
У разі коли хмари значень мають просту форму та перетинаються, треба визначити, чи є кореляція між яскравостями в різних діапазонах спектру, чи ні. Виявити її між яскравостями в різних каналах можна за формою хмарини значень у просторі спектральних ознак. Якщо форма складна, то, звісно, ніякої кореляції немає. Тобто це питання може бути актуальним тільки для еталонів, що мають просту форму хмар значень. Коли ця форма є ідеальною кулею ніякої кореляції немає. А якщо хмарина має форму еліпсоїда, то кореляція має місце. Чим більш сплюснутим та витягнутим є еліпсоїд, тим тісніше кореляція.
У випадках, коли є кореляція між яскравостями в різних діапазонах спектру, найліпше використовувати алгоритм максимальної правдоподібності. А якщо її немає — то мінімальної відстані.
Приклад ситуації, коли необхідно використовувати класифікацію за алгоритмом мінімальної відстані, наведений на рисунку 5. Ліворуч ми бачимо фрагмент знімку Landsat 5 TM, знятий 26 вересня 2009-го року (комбінація каналів 7:5:3). Він охоплює заплаву річки Ворскла та місцевість навколо неї. Ця територія лежить на південь від Охтирки й частково належить до національного природного парку «Гетьманьский».

Рис. 5. Приклад ситуації класифікації зображення за алгоритмом мінімальної відстані
Мета дешифрування в цьому прикладі — виокремлення на знімку різноманітної природної рослинності. Для цього створені чотири навчальних вибірки, що знаходяться праворуч на рисунку 5. Це трав’яна рослинність заплави (жовта вибірка), хвойні ліси (червона вибірка), широколисті ліси (зелена вибірка) та дрібнолисті заплавні ліси (синя вибірка). Унизу на рисунки 5 простір спектральних ознак. У ньому ми бачимо, що три хмари значень трьох вибірок перетинаються. І ці хмари мають просту форму. Це вказує на те, що найкращим чином можна класифікувати зображення за алгоритмом мінімальної відстані.
Приклад ситуації, коли треба використати класифікацію за алгоритмом максимальної правдоподібності, наведений на рисунку 6. Ліворуч на ньому показаний знімок Landsat 7ETM+ 8 серпня 2001-го року (комбінація каналів 7:5:3), що охоплює території вздовж річки Мокра Сура недалеко від її впадіння у Дніпро. Тут дешифрувальник має завдання вести спостереження за спаленням стерні. Для цього йому треба виокремити такі класи: поля зі стернею, поля зі спаленою стернею, поля що мають голий (заораний) ґрунт та поля із зеленою рослинністю. Цим класам відповідають жовта, червона, зелена та синя вибірка (рис. 6, праворуч).

Рис. 6. Приклад ситуації, де ліпше класифікувати зображення за алгоритмом максимальної правдоподібності
Унизу на рисунку 6 показаний простір спектральних ознак: дві хмари значень мають перетинання. Окрім цього, три хмари значень мають продовгувату форму. Це вказує на те, що треба класифікувати зображення за алгоритмом максимальної правдоподібності.
Приклад ситуації, коли необхідно використовувати класифікацію за алгоритмом відстані Махалонобіса, наведений на рисунку 7. Зліва на ньому показаний фрагмент космічного знімку Landsat 5TM за 8 жовтня 2011 року (комбінація каналів 4:5:3). Він охоплює територію навколо річки Сіверський Донець на південь від Бєлгородського водосховища. Тут треба виокремити на знімку три класи: хвойні ліси, листяні ліси та трав’янисту рослинність. На рисунку 7 праворуч навчальні вибірки для цих класів мають відповідно зелений, червоний та синій кольори.
Розглядаючи простір спектральних ознак (рис. 7, знизу), ми бачимо, що вибірки перетинаються. Окрім того, «синя» вибірка має складну форму типу «хвіст ластівки ». Це вказує на те, що треба класифікувати зображення за алгоритмом відстані Махалонобіса. Слід звернути увагу на те, що в інших прикладах хмари значень яскравості трав’янистої рослинності мали форму наближену до простої (рис. 4 та рис. 5). У цьому випадку навпаки. Так склалося тому, що трав’яниста рослинність на знімку більш різноманітна. Це разом заплавна та суходільна рослинність.

Рис. 7. Приклад ситуації, коли треба використовувати класифікацію за алгоритмом відстані Махалонобіса
Таким чином, ми розглянули як саме обрати один з алгоритмів класифікації з навчанням для різних ситуацій. Останній приклад показує, що для одного й того ж типу об’єктів немає універсального алгоритму класифікації, котрий завжди буде ефективним. Кожного разу треба досліджувати розміщення хмар значень класів у багатомірному просторі спектральних ознак.


Дуже дякую за якісну статтю. Саме сьогодні зіткнувся із завданням автоматизованого дешифрування.
На практиці зазвичай доводиться робити класифікацію в кілька етапів (так звана гібридна класифікація). Класифікація за один раз це швидше виняток. Плюс щоб отримати хороший результат треба робити постобробку.
Дякую за цікаву статтю. Але як би ж то так все просто було: зазвичай всі класи так змішуються, що взяти і відкласифікувати одним махом не виходить. Завжди додаткові танці. Це риторично-ліричне зауваження було.
А практичне – варто гарно продумувати навчальну вибірку, її величину та репрезентативність, аналізувати на нетипові значення, а тоді вже досліджувати з позиції вибору методу класифікації. Пару “вильотів” і картинка розподілу у просторі ознак буде спотвореною.