When I need to explain what OpenStreetMap (OSM) is, I say something like “Have you heard of Wikipedia? Well, it’s the same but for cartography”. Some of my colleagues may call this answer primitive, remind of Wikimapia, dozens of other crowdsourced services, or even may imply that “drawing lines on the Internet” has nothing to do with “real cartography”.
Surely, they are right in many ways, but in my everyday life when I need to find out a word’s meaning I open up Wiki, and when I need geodata I open OSM.
In Ukraine as of end of 2015, there are over 8000 users editing OSM. Generally, these are IT-enthusiasts, and they don’t have a lot to do with cartography, GIS or remote sensing. However, their lack of knowledge did not interfere in creating one of the most detailed and accessible sources of spatial data in Ukraine. Most of the credit belongs to OSM developers and community. It is incredibly easy to become an OSM editor, simply press Edit and start digitizing roads and buildings from an image. At the same time OSM gives nearly unlimited possibilities for professional growth to an editor. Gradually one can delve deeper, from simple browser iD editor to powerful JOSM that has a variety of plugins, start collecting data with a GPS receiver, correct errors made by other users. These kind of features make OSM a great educational tool. It can be used, for example, for students of geodesy, cartography and land management.
The Idea
The educational process in a modern Ukrainian establishment has such ways of teaching as lectures, lab works, practicals and seminars, and individual work of students. The latter mainly come down to an A4 sheet with essay topics, that a student needs to write during the semester. Writing and checking these essays is a kind of zen practice illustrating the meaninglessness of Life, the Universe and all (in other words the work is downloaded from the Internet, and not read either by the student or the teacher – plagiarism is not something dwelled on in our system). So, as a lecturer of ‘Information systems and GIS-technologies in geodesy and land management’ course I had an idea to change essay writing to some other practical activity useful for both the students and the society.
As the first idea for this kind of task was creating small GIS-projects with topics relevant to environment or society. Individual character of the tasks decreased plagiarism greatly, but at the same time the number of students willing to do them decreased. These kind of tasks were taken by top rated students that were to get high grades anyways.
When giving advice to students on their individual work I often suggested them to use OSM data instead of digitizing old soviet maps. OSM appeared to have more accurate data and easier to use, but did not always contain all the information needed, so the students has to register on the website and edit the areas they were to use. This is how an idea to involve students in editing OSM came to be.
I have to indicate that it is not an innovation in any way. I know of a few projects working with OSM in schools and unis. But one thing is reading about foreign experience in EU or US, and another is implementing it in your own institution. This post is about this kind of local experience.
Implementaion
The main question that the student has when hearing about a new kind of assignment is “How many credits will I get for this?”. For this individual task in OSM editing I had decided to give 20 extra credits (these are the credits on top of the 100 one might get while following the course). So, in case of successful task implementation a student was entitled to receive one fifth of the maximum course grade. But next, the evaluation was under consideration. There were several way to do it:
→ Binary assessment. So the 20 credits went to anyone who had registered and created at least one object on the map. This was not a good option, as most students would stop after making that first object.
→ Number of edits assessment. An OSM user profile stores a value for the overall number of edits a user made. One edit is actually everything that was done by the user after pushing the ‘Edit’ button until exiting the web-site of the editing software. So, one edit can be creating one object as well as a thousand. This was of assessment would be unfair.
→ Assessing the number of nodes, ways and relations. Apart from the general number of edits, OSM enables getting a detailed statistics of all the actions performed by a specific user. This statistics can be obtained from external services. One of these is “How did you contribute to OpenStreetMap?” (figure 1). It shows the exact number of nodes, ways and relations created, edited or deleted by any user, objects can be viewed, as well as time of their creation and the type of editor used.
Figure 1. “How did you contribute to OpenStreetMap?” service interface
The latter option was used for task evaluation, it shows the exact amount of work performed.
For the process to be more interesting, I had decided to avoid hard limits like “1000 node equals 20 credits”. Instead I turned the assignment into a competition. The highest number of credits were to be assigned to a student with the highest number of nodes, ways and relations. The marks for other students were to be proportional to the winner’s result. For example, if the top result is 30 000, the student that has 15 000 gets 10 credits.
Results
To complete this task the students had a little over four months. The course was taken by 24 third year students majoring in geodesy, cartography and land management. They had few GIS-related courses beforehand, only one lecture on geo information science during a cartography course and several practicals in image classification for their remote sensing course.
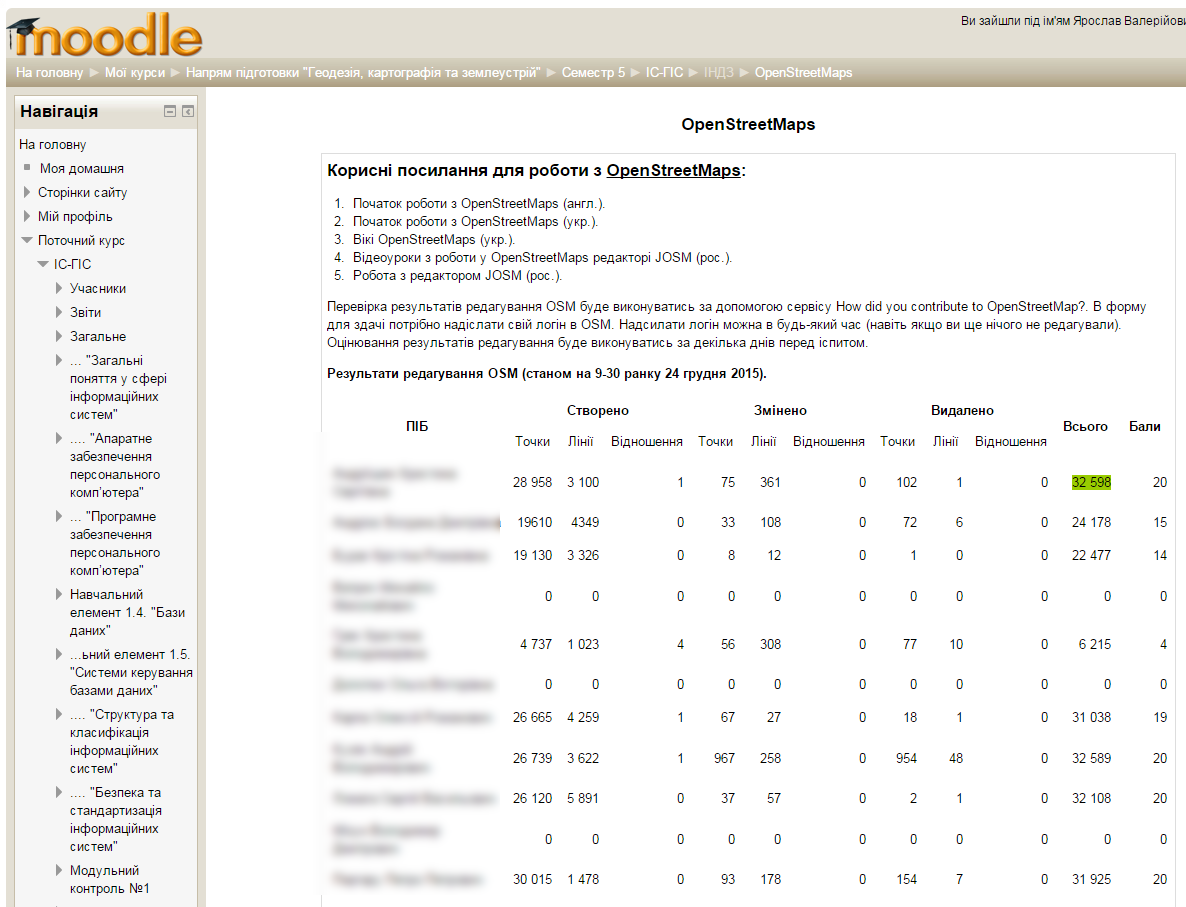
At the first lecture I briefly explained what the OSM project was about, spoke about the main principles of editing and assessment criteria. A separate page on the course portal was created containing several videos with OSM editing tutorials, links to OSM user forum, OSM wiki-portal and intro to JOSM editor. Using this page the students were able to indicate their login for OSM for further assessment (figure 2).
Figure 2. E-learning web-page with useful links and OSM editing results
The students started working on the assignment actively only in the end of October, when the results of the results of the first module control became available and exams were in the close future. The number of questions about OSM editing increased, during lab works a number of students instead of logging into their social networks started logging into OSM when the main practicals were done with.
Of course, the peak activity fell on several weeks before the exams. Even during pre-exam consultations students were still using the lab for working on the OSM assignment.
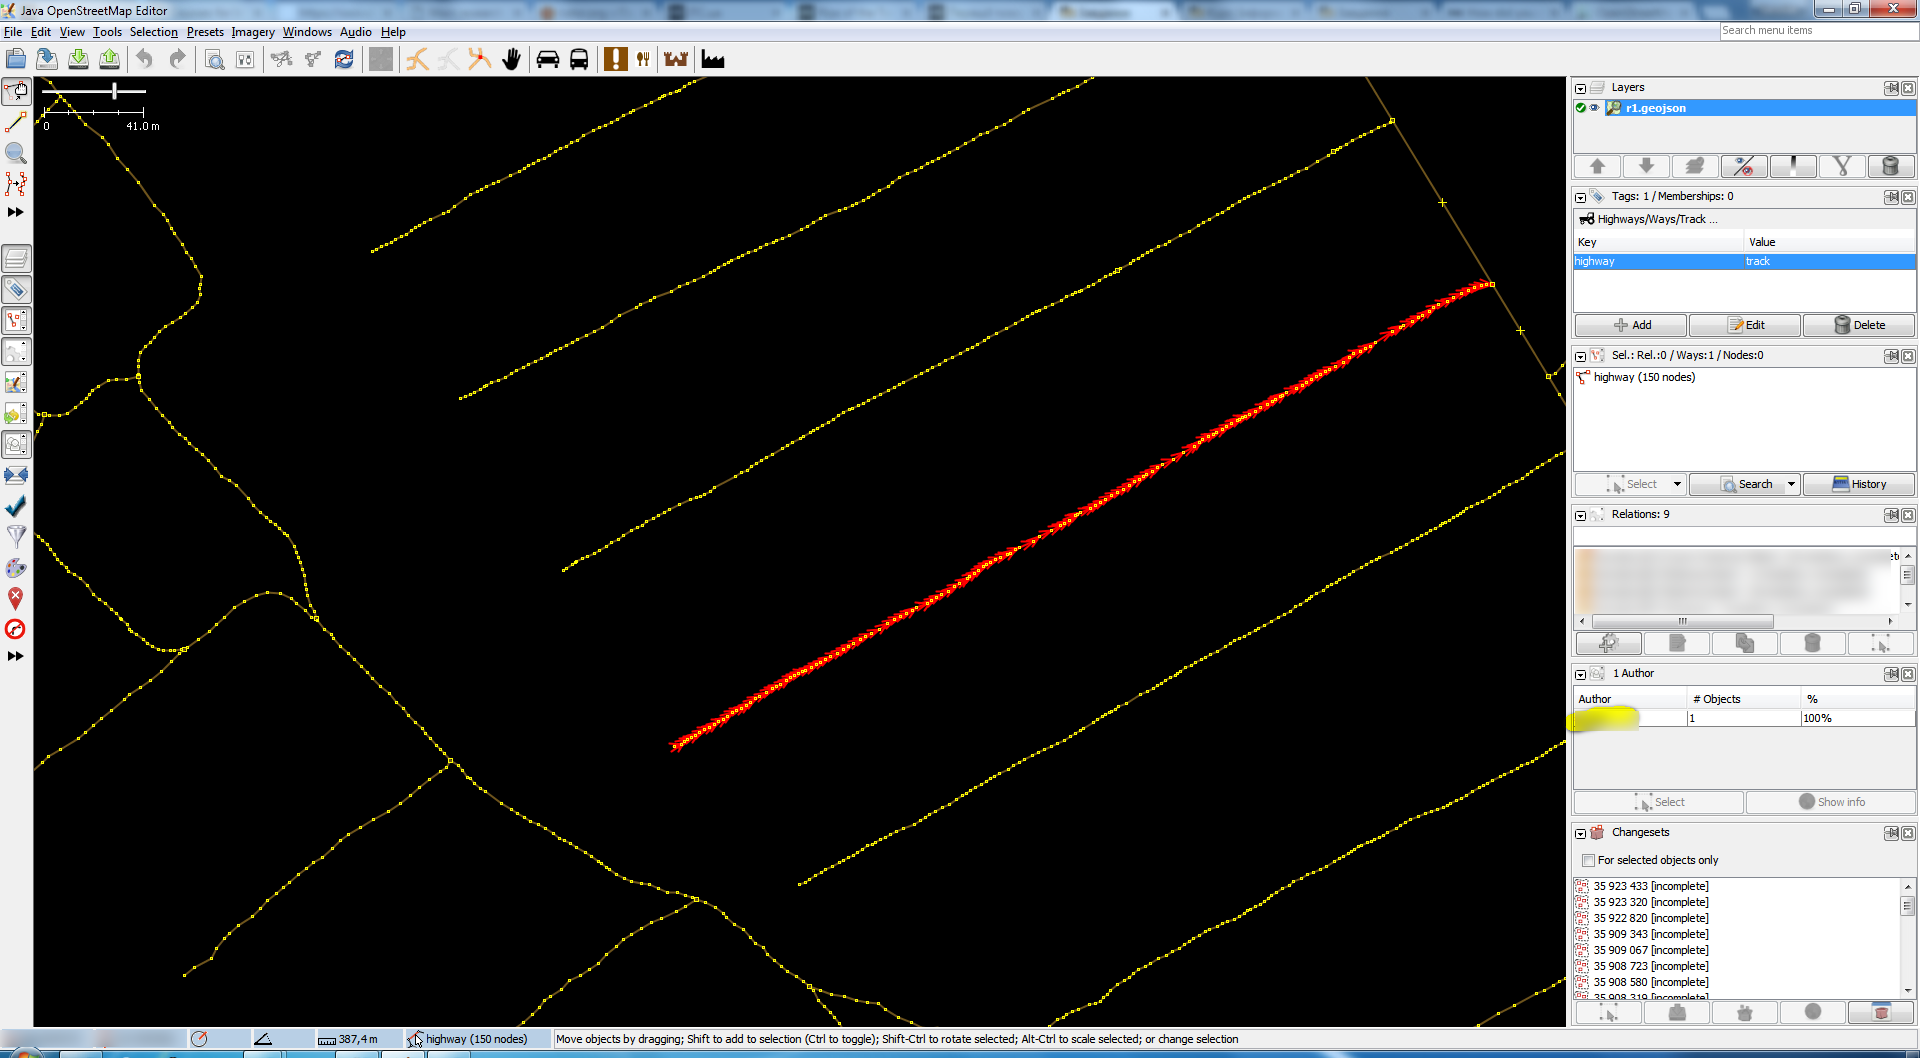
Work evaluation required checking the number of edits performed by each login using How did you contribute to OpenStreetMap?” service. Consecutively, the edits in the *osm format were loaded into JOSM and checked. That way I was able to advise every student on how to increase the quality of the work and point of errors, if any. Additionally, this check helped to check the student’s honesty. Figure 3 shows an iconic way of cheating at the task.
Figure 3. Increasing the number of nodes to boost up the final result
Because of placing a node every 0.5-1 metres only several small rural roads gave the student one of the top results. Clearly, this work was not counted in the overall result and the students were asked not to vandalize the cartography. No other cheating attempts were discovered after this incident. The too clever student deleted all the inaccurate edits, created a new account and had enough time to create enough features (then he quit smoking and started singing in the church choir).
Overall results on the individual assignment:
Total created:
285 503 nodes;
43 960 ways;
15 relations.
They are:
153 amenity;
35 196 building;
1 842 highway;
4 223 landuse;
83 leisure;
85 name;
705 natural;
9 addr.
Surely, in the learning process the quantitative results play a secondary part. More important is the educational effect and the impact on the OSM project. This is not as straightforward, and needs further discussion of the pros and cons.
Advantages of using OSM in education
The main advantage of using an assignment like this is a general increase of student involvement. Oftentimes the students are guided by their parents to pursue education and frankly do not understand what their knowledge can be used for in the future. Editing OSM lets to see the result straight away. Additionally, it came as a surprise for many students that there are a lot of people doing the same thing, editing the map, simply because it is useful for the society and gives some kind of closure.
The overall detail level of OSM is increased. As compared to other countries, the level of detail in OSM is still rather low. That is why creating any new features is an asset. Furthermore, nearly all of the students learned one of the main principles – it’s best to edit an area one is familiar with. That is why after the assignment was complete a lot of small villages and towns in Chernivtsi, Ternopil, Ivano-Frankivsk, Khmelnytsky and Vinnytsia regions became more detailed – the places where the future cartographers were from.
Obtaining and developing skills in image interpretation and digitizing. These skills are surely an asset for the future cartographers, but there is not enough time in the study program. That is why the task develops the skills to interpret imagery and digitize areas the students have seen with their own eyes.
Disadvantages of using OSM in education
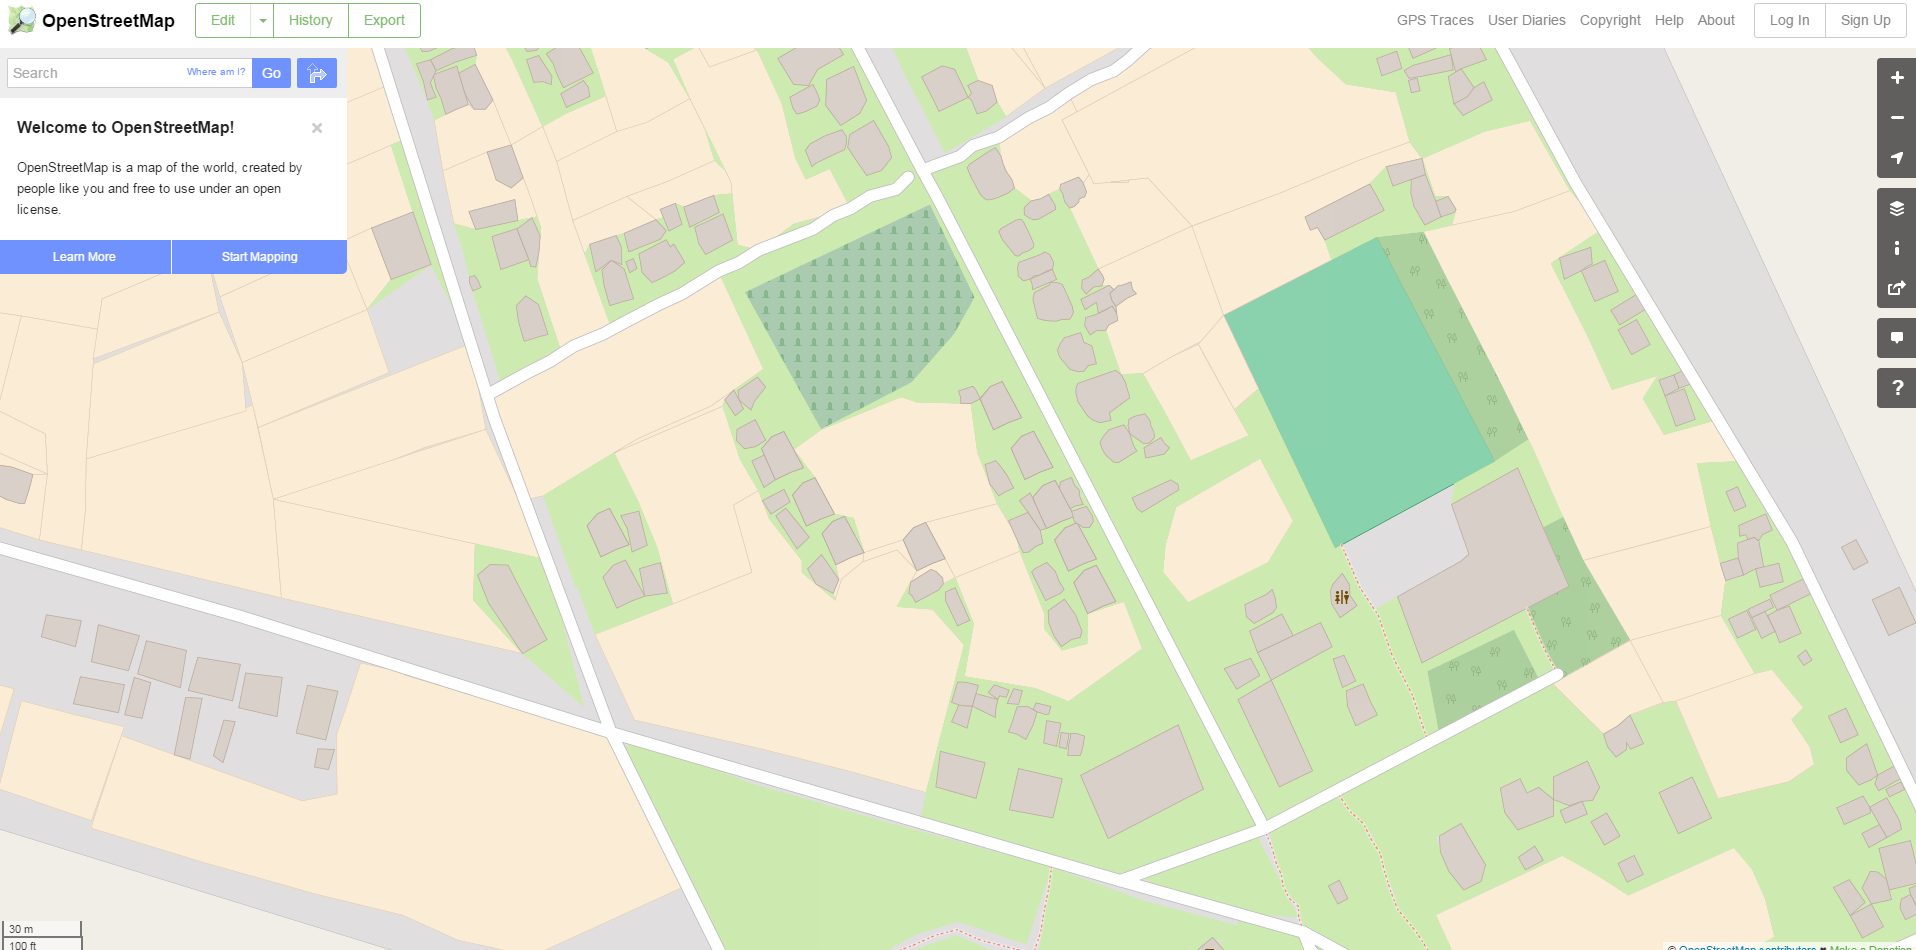
Quality decrease. Not all of the students treat the assignment with equal responsibility. Some only edited the map to get a few more points with no second thoughts about the meaning and quality of the results. Figure 4 shows one of the examples of that kind of approach. It appears that the inhabitants of that specific village have a very strong inclination against even angles. I haven’t found any effective way to change this situation except for asking not to do it. Formally, the work is done, and no one will want to fix every single building on the map.
Figure 4. Poor quality digitizing
Too many nodes. Knowing that the credits are influenced directly by the quantity of the nodes, it’s clear that the students would overuse this. And if the extremes like in figure 3 can be easily traced, the milder versions (e.g. having 8 nodes instead of 4) are harder to find.
Observations
Finally, some observations I had when checking the OSM edit results.
First thing all the girls put a profile picture. There may be no edits in the account, but there will be a selfie for sure.
The most active editors were not the top students, but average students with grades around 3-4. For example, the highest results were achieved by those who failed to finish most lab works. Possibly this is due to the task simplicity and practical orientation.
For many students it was a revelation that others reviewed their work. Once a startled student ran to me during a break saying something like “Someone is writing to me telling to change primary to residential. How did he find out I did that?” I had to explain OSM principles and asked to account for moderators’ requests.
Some people digitized the buildings together with the backyard. When I asked why the students do it that way, I got a logical explanation “A house is not a house without the vegetable garden”.
Prospects
Generally, I would call my OSM teaching experience positive. However, there is a lot of room for improvements. Here are some of the possible ones:
motivating the students to shift from the browser Id editor to JOSM;
creating a detailed map of a small area together using ground truth collected with a GPS receiver;
student group work on adding features of a specific type to OSM.



glad to read this, great works..!!
також читала з задоволенням!
чудова стаття. дякую!